Metrics
Metrics are a measure of the evolution in time of some aspect of your life. It is often useful toquantify certain aspects of your life, and keep special tabs on it. Metrics allow you to trackyour weight, your retirement savings, days gone to the gym, miles run, etc.
Metric entries are the records of the value of a certain metric at a certain time.
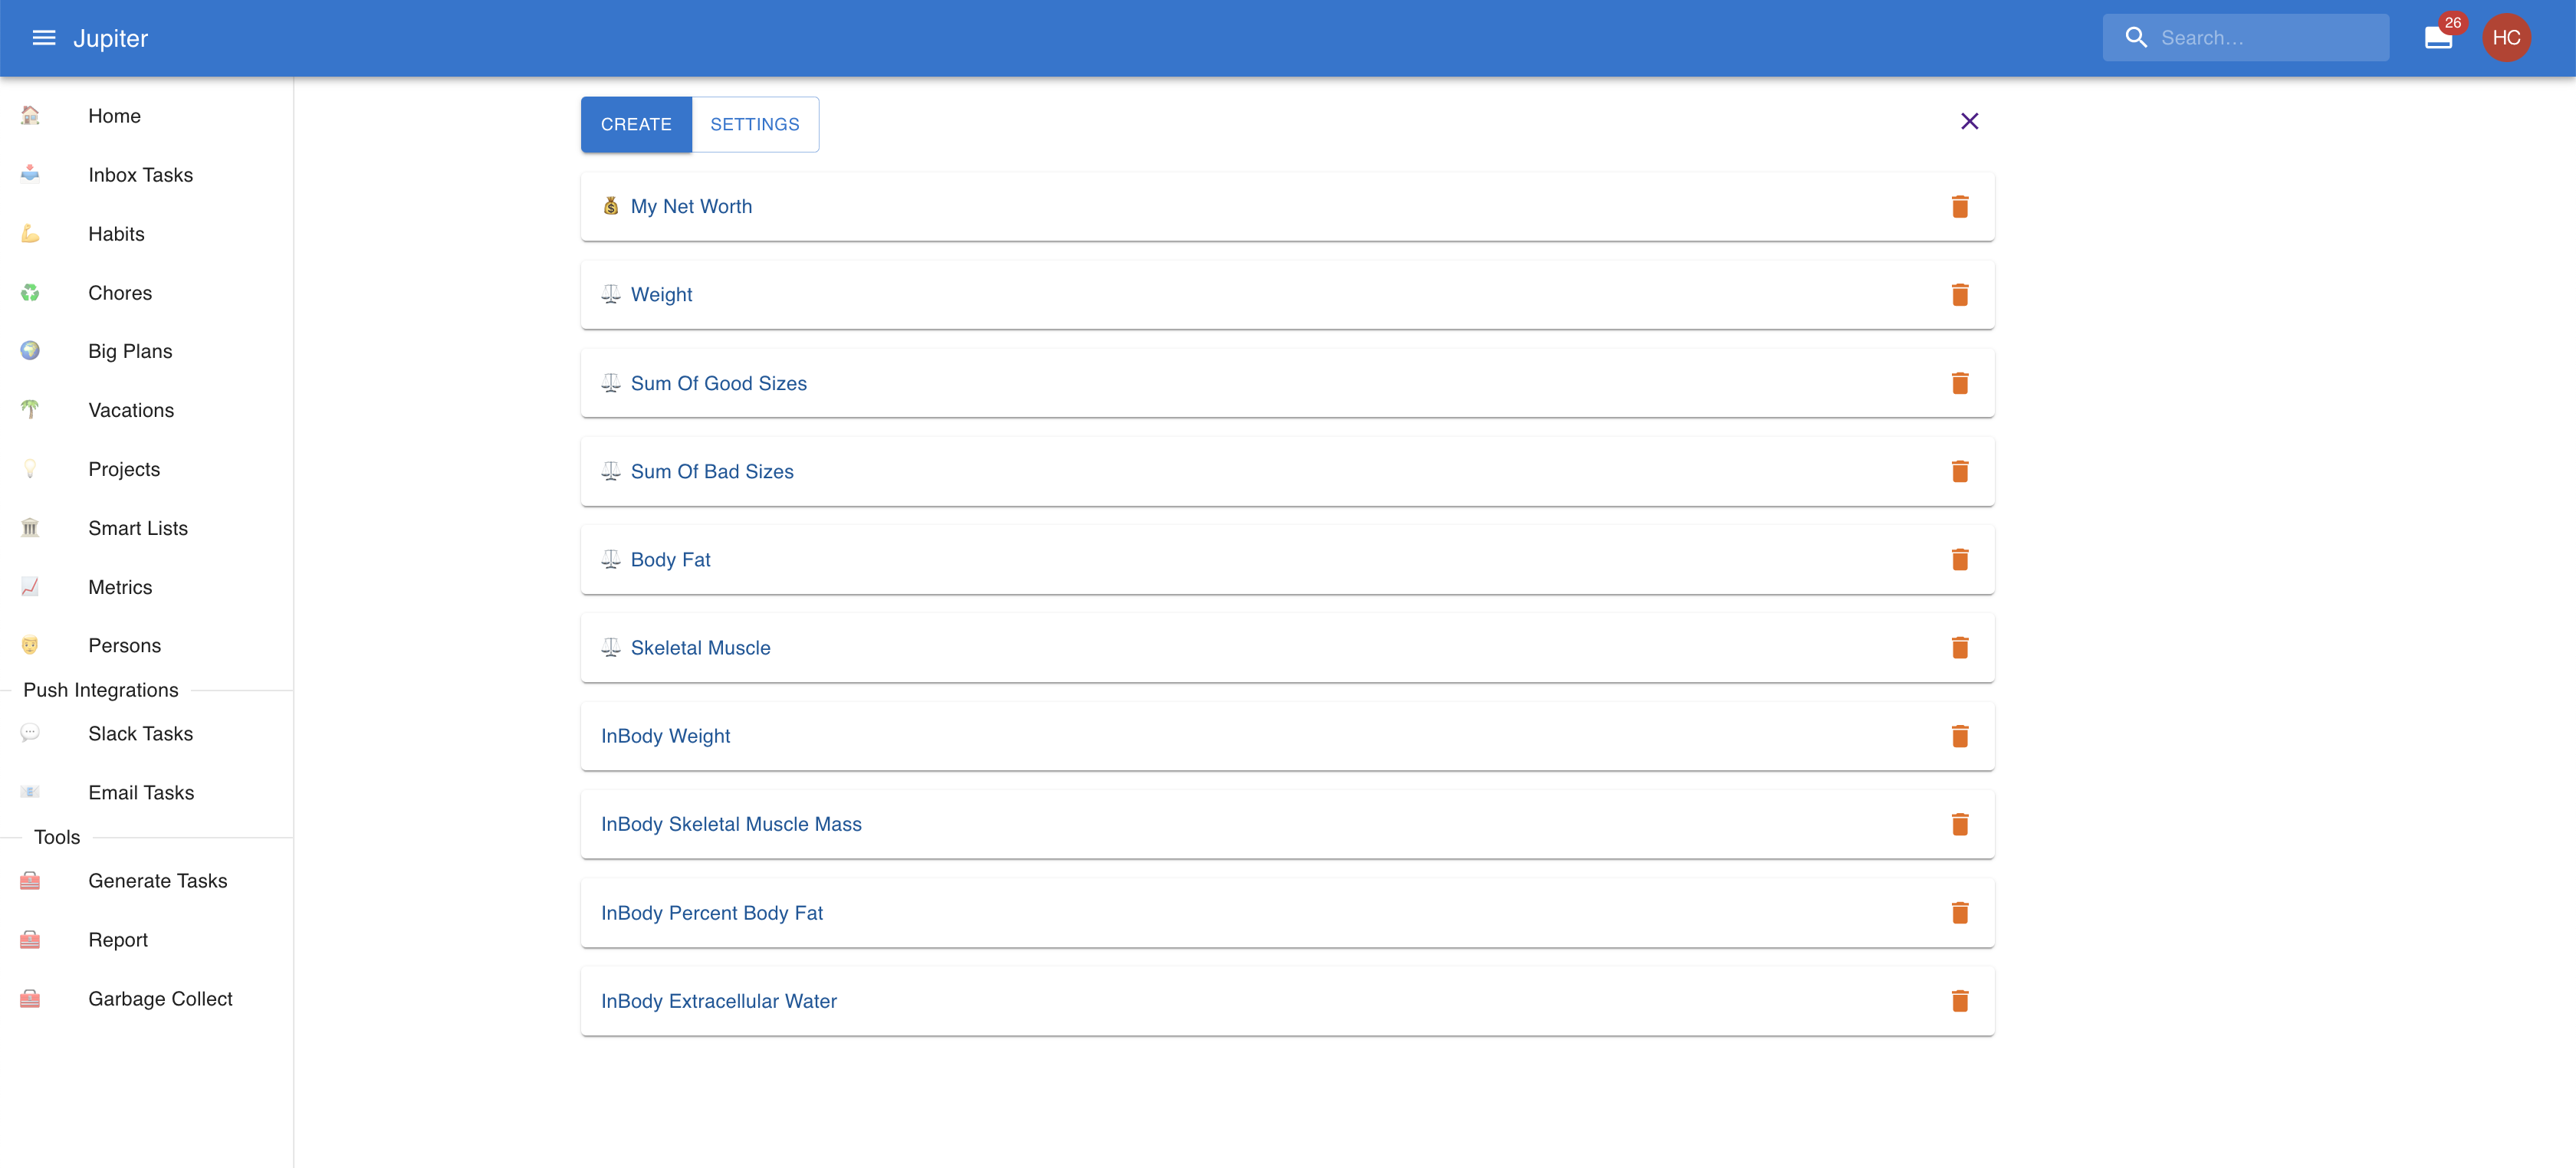
In the workspace overview, you can view the set of metrics:
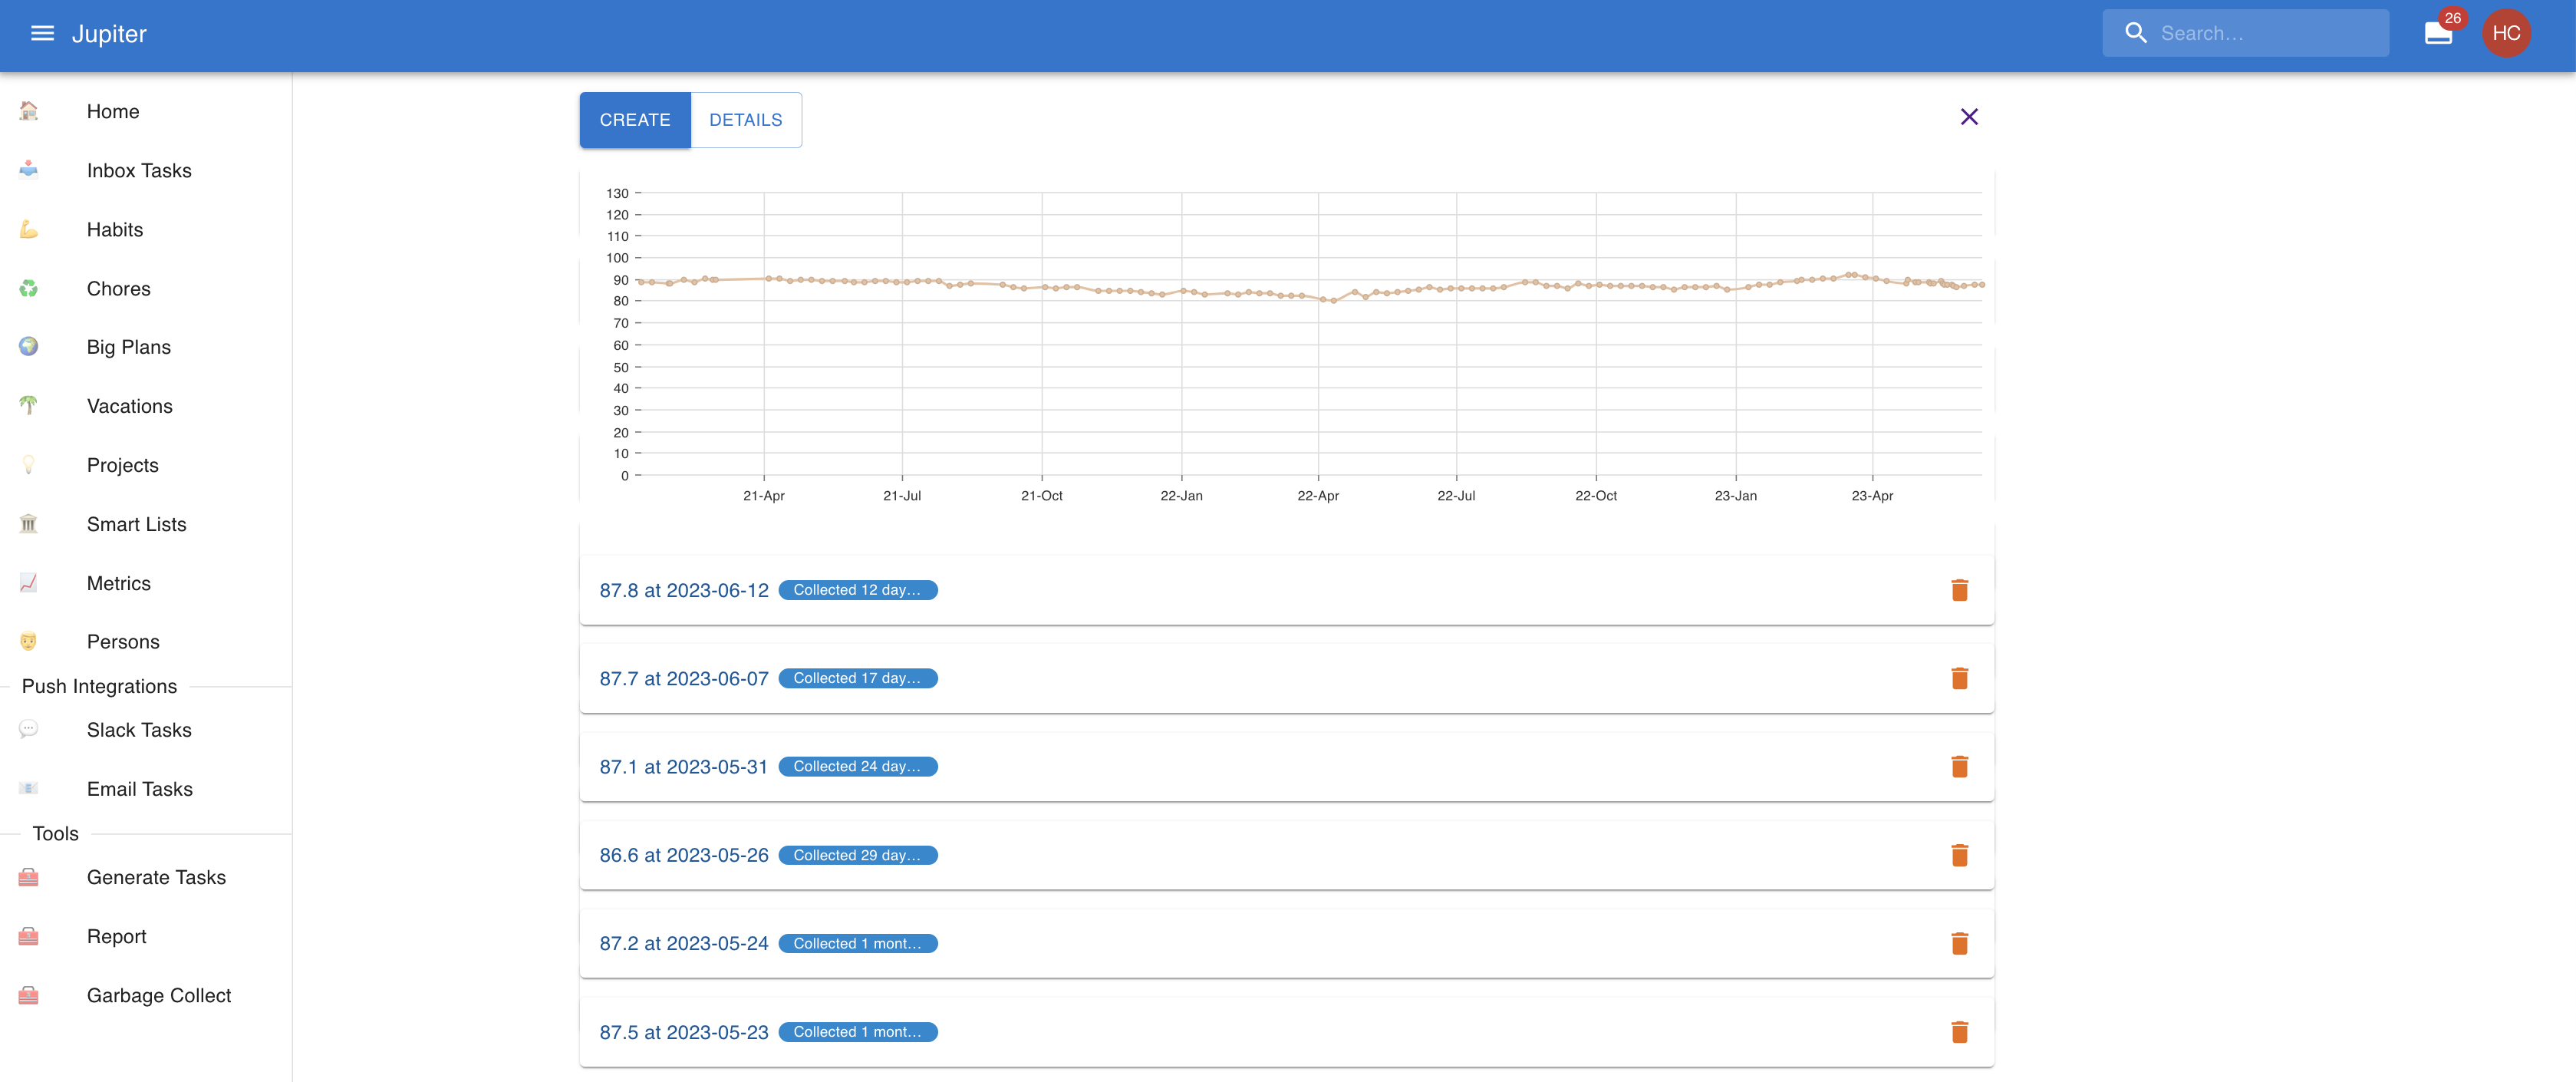
Each metric contains many entries or records, for example:
Properties
Metrics have a name. It's the nicely looking counterpart to the key.
Metrics can be marked as key metrics. This is first a user-level concept - it marksthe metric as an important one for you, that is absolutely necessary to get right. Invarious other contexts it applies, helping with sorting, prioritization, etc.
Metrics can also have an icon. It's a nice unicode glyph like 💰 or ⚖️ and it serves tovisually distinguish the metric.
Metrics can also have a unit. It adds extra info about what exactly you're recording - weight,currency, the count of an event, etc.
Metrics can have a collection aspect and collection period. It makes sense to record (or collect)the value of a metric regularly. Think of your weight or the number of kilometers run in a week. Toallow for this, special collection inbox tasks can be generated for the metric, just like ahabit. The collection period will determine how often the taskis generated (weekly, monthly, etc.). The inbox tasks will go to the configured aspectif it is present, or to the default workspace one if it is missing. If noneare present, generation will fail. There's also all the other collection parameters (actionabledates, due dates, Eisenhower statuses, etc).
Metric entries have a collection time - the time they were recorded.
They also have a value - the actual value for the metric at that particular time.
Metric entries can also have some notes attached to them, for any extra info you might want to add.
Metric Direction
Each metric can define a direction that tells Thrive how to interpret change:
- Up is good: higher values are better (for example savings).
- Down is good: lower values are better (for example resting heart rate).
- None: no good/bad interpretation is applied.
In the metric entries list, Thrive compares each entry to the previous one and shows a small delta indicator (arrow + value change), rounded to two decimals. The indicator is colored to reflect whether the change is good or bad according to the chosen direction.
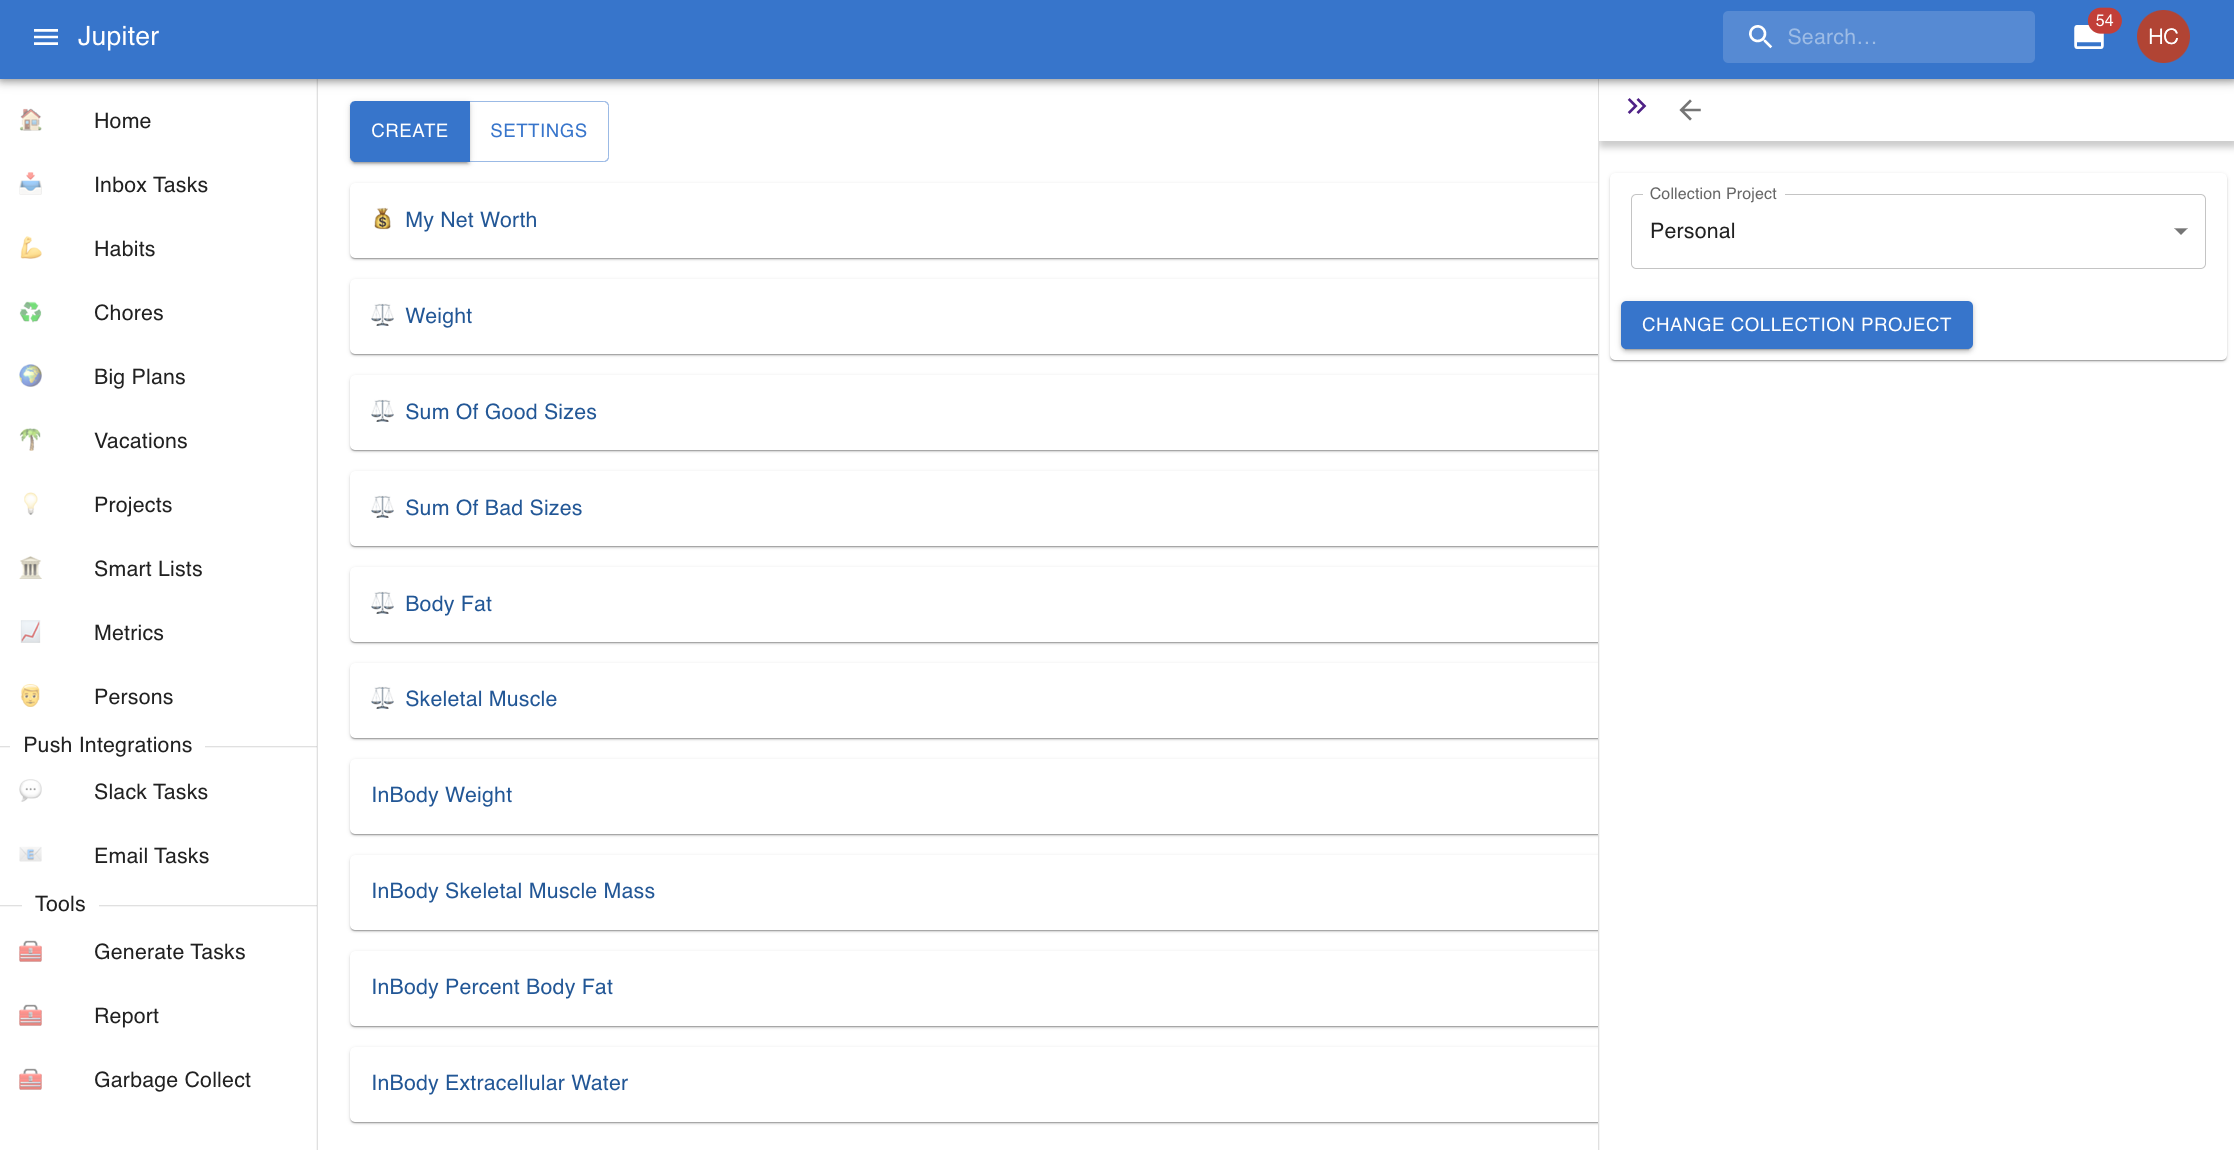
Metrics Settings
In the web app you can change the global collection aspect via the Settings
button:
And you can change the properties of a metric by clicking on it in the view.